Grafana Getting Started
Grafana Grafana is the leading open source project for visualizing metrics. Supporting rich integration for every popular database like Graphite, Prometheus and InfluxDB.
If you have installed Websoft9 Grafana, the following steps is for your quick start
Preparation
- Get the Internet IP of your Server on Cloud
- Check your Inbound of Security Group Rule of Cloud Console to ensure the TCP:80 is allowed
- Complete Five steps for Domain if you want to use Domain for Grafana
- Get default username and password of Grafana
Grafana Initialization
Steps for you
-
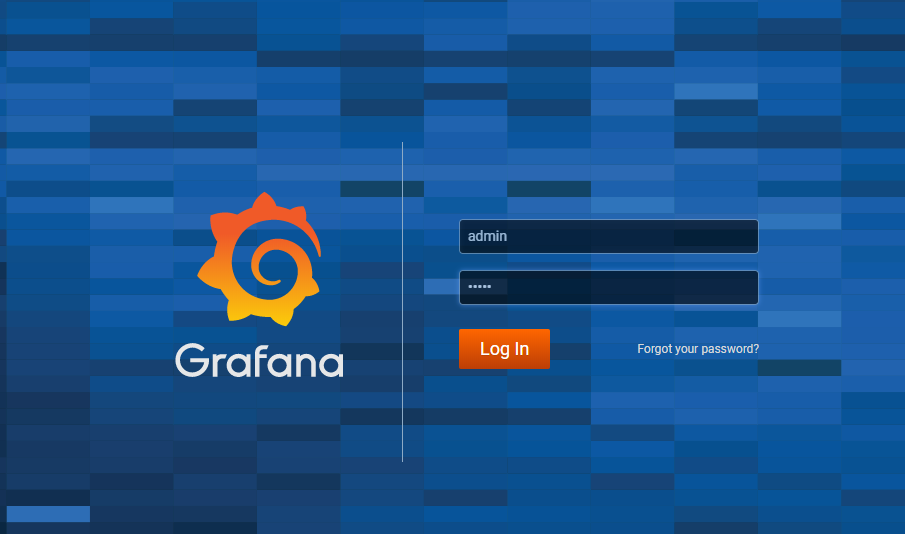
Using local Chrome or Firefox to visit the URL http://domain name or http://Internet IP, you will enter the register interface of Grafana
-
Input the username and password, (Don't have password?)
-
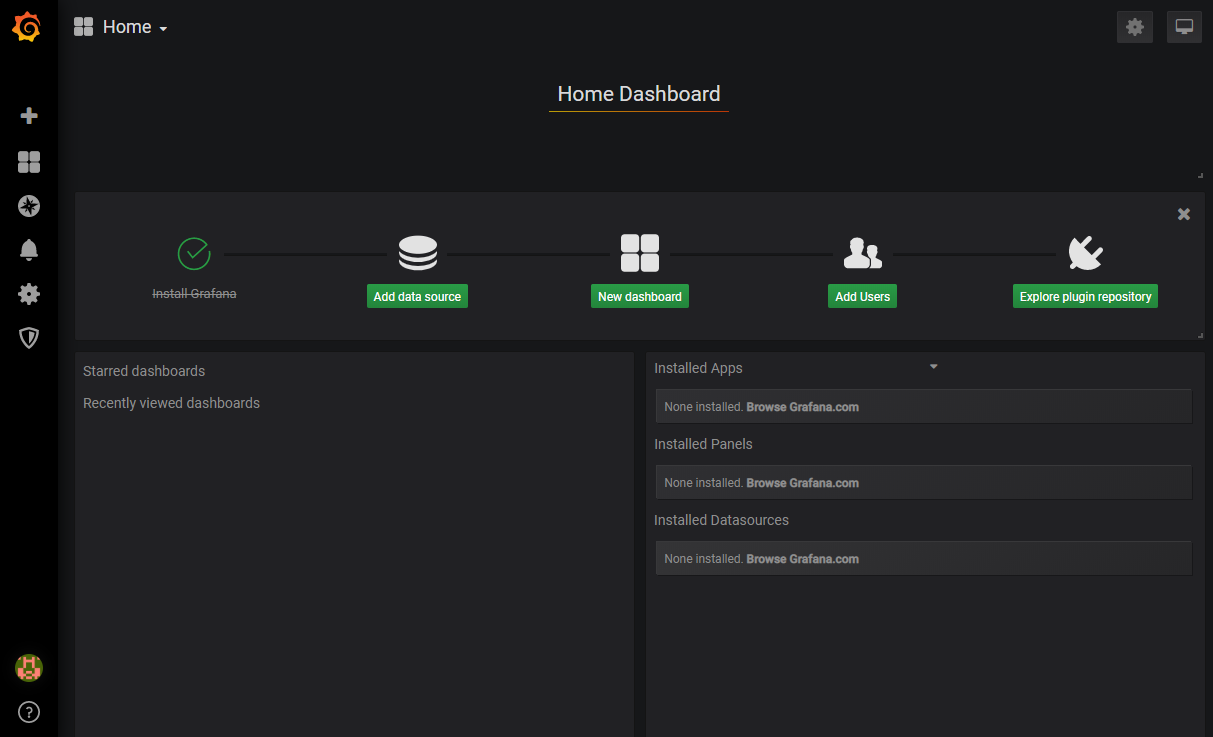
Log in to the Grafana Console
-
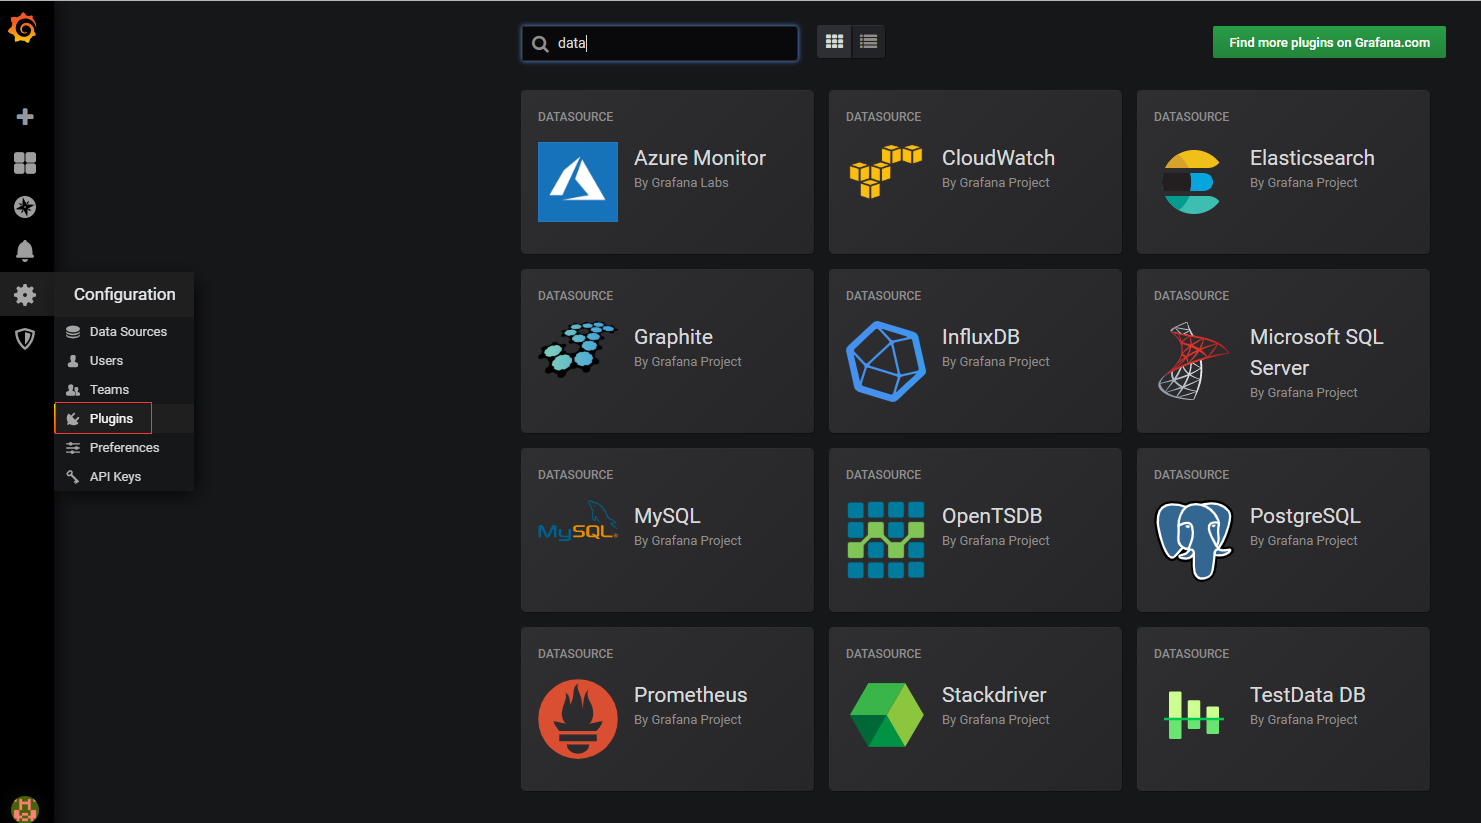
Open Configuration > Plugins to add plugins for function extension
-
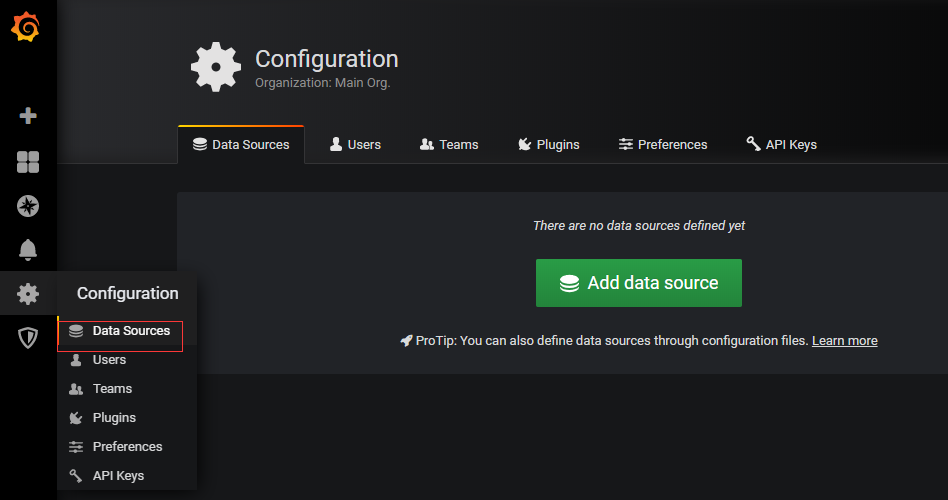
Open Configuration > Data Sources to add data source for analysis
-
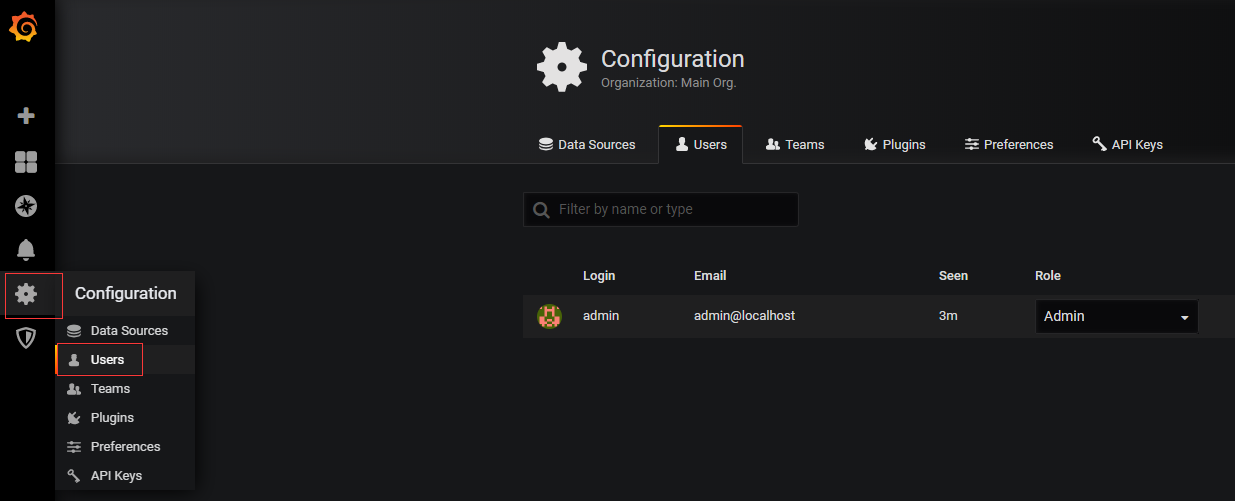
Open Configuration > Users to add user
More useful Grafana guide, please refer to Grafana Documentation
Having trouble?
Below is for you to solve problem, and you can contact Websoft9 Support or refer to Troubleshoot + FAQ to get more.
Grafana QuickStart
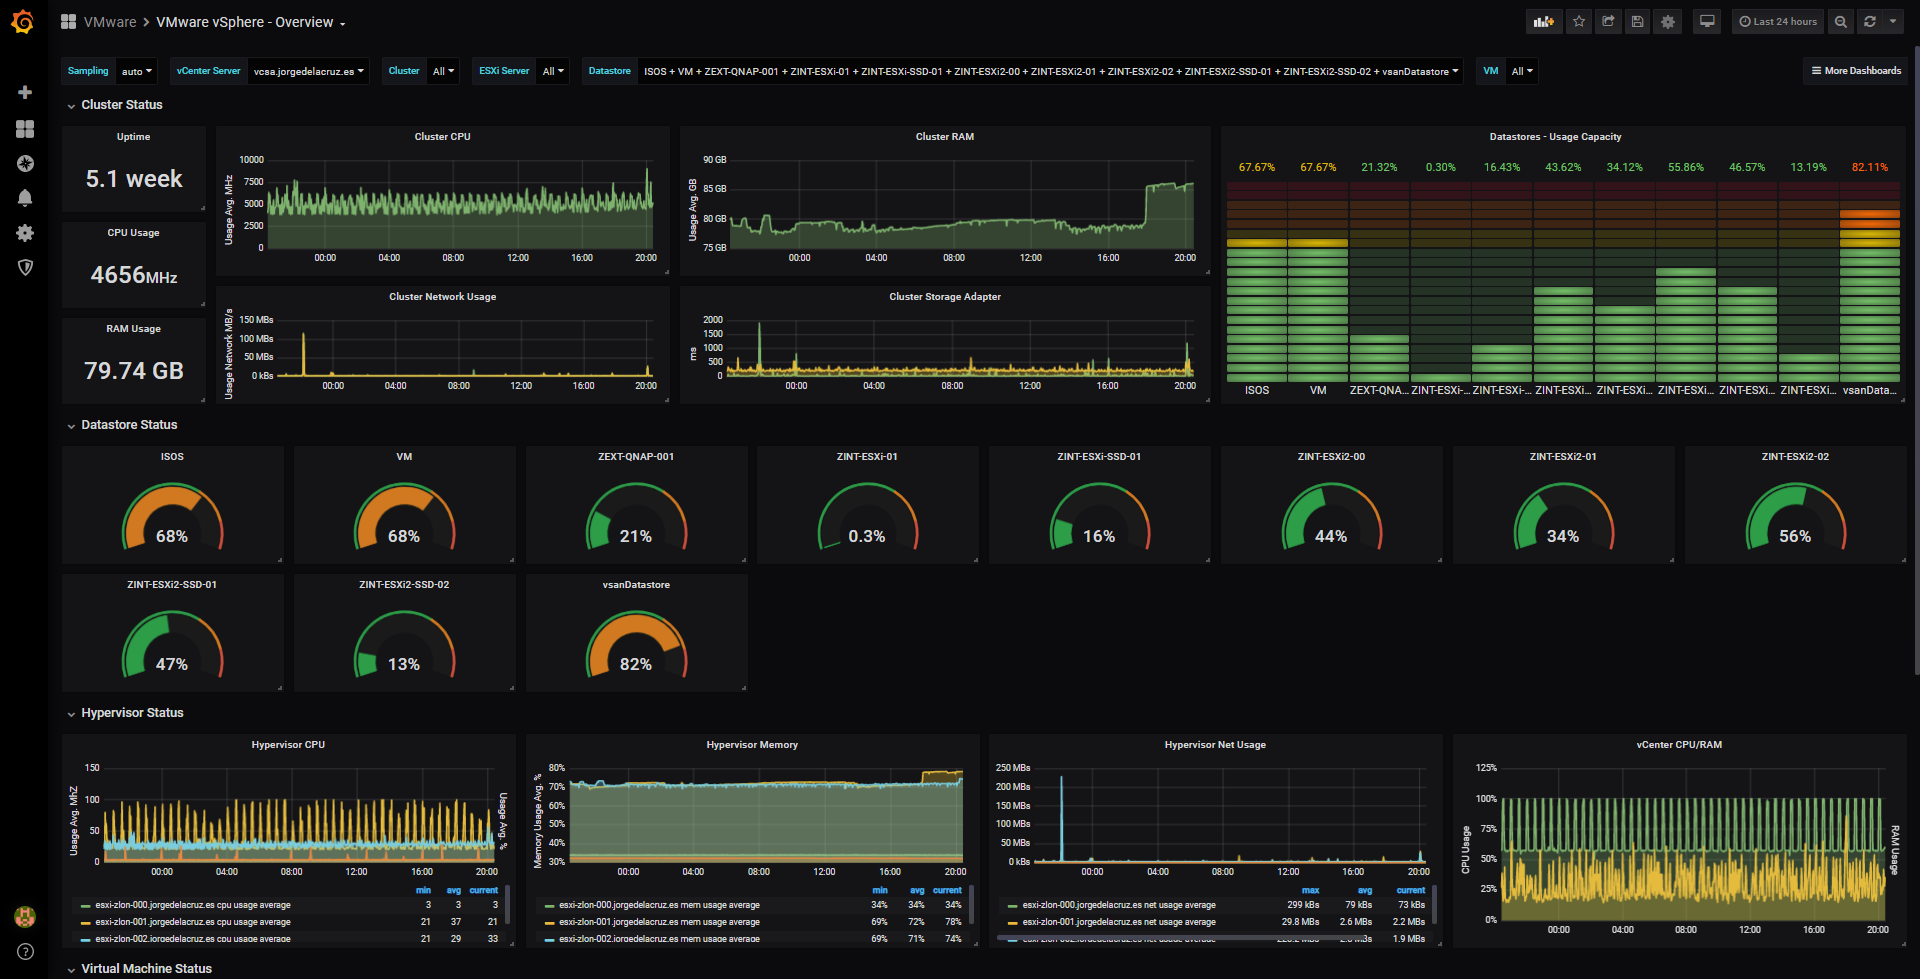
The following uses xxx configuration data monitoring as an example.
Grafana Setup
Configure SMTP
-
Get SMTP related parameters in the mailbox management console
-
Edit the SMTP segment part in Grafana configuration file and fill in your SMTP items
#################################### SMTP / Emailing #####################[smtp]enabled = falsehost = localhost:25user =# If the password contains # or ; you have to wrap it with triple quotes. Ex """#password;"""password =cert_file =key_file =skip_verify = falsefrom_address = [email protected]from_name = Grafanaehlo_identity =[emails]welcome_email_on_sign_up = falsetemplates_pattern = emails/*.html -
Restart Service
sudo systemctl restart grafana-server -
Log in Grafana Console, Open: Alerting > Alert Rules, create new Notification Channel and select the type with Email
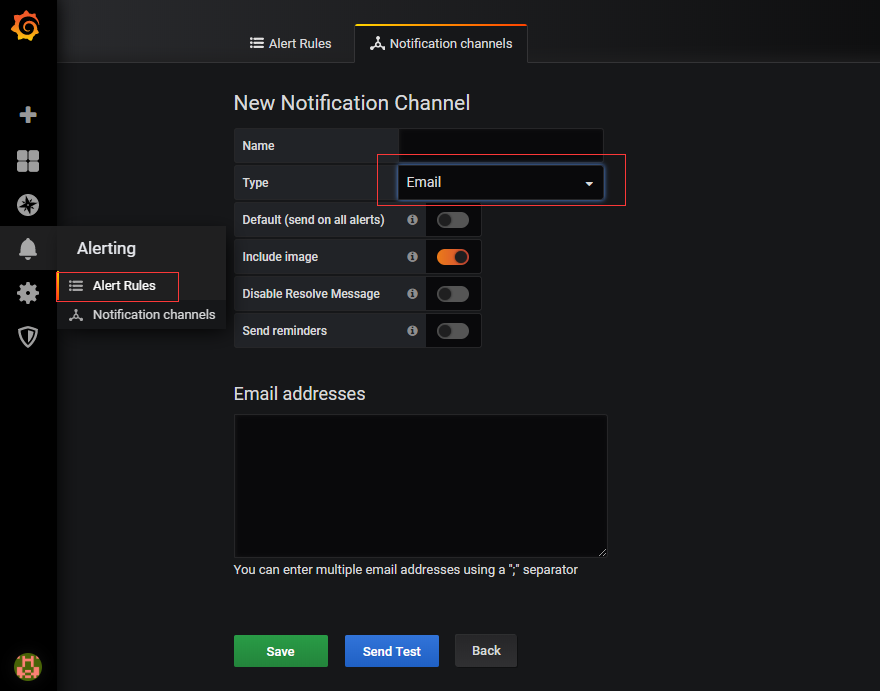
-
Click the Test Connection, you can get the feedback "no errors were..." if SMTP is useful
Reset Password
SSH login to the server, run the following command
# Modify administrator password
sudo docker exec -it grafana grafana-cli admin reset-admin-password admin123
Grafana reference sheet
The below items and General parameter sheet is maybe useful for you manage Grafana
Run docker ps, view all containers when Grafana is running:
CONTAINER ID   IMAGE                    COMMAND                  CREATED          STATUS          PORTS                                       NAMES
0e8348b13542   phpmyadmin:latest        "/docker-entrypoint.…"   12 minutes ago   Up 12 minutes   0.0.0.0:9090->80/tcp, :::9090->80/tcp       phpmyadmin
12bb28a1571e   grafana/grafana:latest   "/run.sh"                13 minutes ago   Up 13 minutes   0.0.0.0:9001->3000/tcp, :::9001->3000/tcp   grafana
5eaf5c965651   grafana/promtail:main    "/usr/bin/promtail -…"   13 minutes ago   Up 13 minutes                                               grafana-promtail
610a9ad5edfe   mysql:5.7                "docker-entrypoint.s…"   13 minutes ago   Up 13 minutes   3306/tcp, 33060/tcp                         grafana-db
49b08cdf0e3d   grafana/loki:main        "/usr/bin/loki -conf…"   13 minutes ago   Up 13 minutes   3100/tcp                                    grafana-loki
Path
Grafana install directory: /data/apps/grafana
Grafana configure file: /data/apps/grafana/data/grafana_config/grafana.ini
Grafana log directory: /data/apps/grafana/data/grafana_logs
Grafana datadirectory: /data/apps/grafana/data/grafana_data
Port
No special port
Version
# Grafana Version
sudo docker exec -it grafana grafana-cli -v
Service
sudo docker l start | stop | restart | stats grafana
sudo docker l start | stop | restart | stats grafana-db
sudo docker l start | stop | restart | stats grafana-promtail
sudo docker l start | stop | restart | stats grafana-loki
CLI
Grafana CLI tools grafana-cli, for full management and configuration Grafana
$ docker exec -it grafana grafana-cli -h
NAME:
   Grafana CLI - A new cli application

USAGE:
   grafana-cli [global options] command [command options] [arguments...]

VERSION:
   8.4.4

AUTHOR:
   Grafana Project <[email protected]>

COMMANDS:
   plugins  Manage plugins for grafana
   admin    Grafana admin commands
   cue      Cue validation commands
   help, h  Shows a list of commands or help for one command

GLOBAL OPTIONS:
   --pluginsDir value       Path to the Grafana plugin directory (default: "/var/lib/grafana/plugins") [$GF_PLUGIN_DIR]
   --repo value             URL to the plugin repository (default: "https://grafana.com/api/plugins") [$GF_PLUGIN_REPO]
   --pluginUrl value        Full url to the plugin zip file instead of downloading the plugin from grafana.com/api [$GF_PLUGIN_URL]
   --insecure               Skip TLS verification (insecure) (default: false)
   --debug                  Enable debug logging (default: false)
   --configOverrides value  Configuration options to override defaults as a string. e.g. cfg:default.paths.log=/dev/null
   --homepath value         Path to Grafana install/home path, defaults to working directory
   --config value           Path to config file
   --help, -h               show help (default: false)
   --version, -v            print the version (default: false)
API
Grafana API adopt the REST API 2.0 specification.