Grafana
Grafana is The leading open source project for visualizing metrics, used for Data Insights & BI Log Analytics Device Management and Monitor . A leading open source project for visualizing metrics. Supporting rich integration for every popular database.
Prepare
When referring to this document to use Grafana, please read and ensure the following points:
-
Login to Websoft9 Console and find or install Grafana:
- Go to My Apps listing applications
- Go to App Store installing target application
-
This application is installed by Websoft9 console.
-
The purpose of this application complies with the AGPL-3.0 open source license agreement.
-
Configure the domain name or server security group opens external network ports for application access.
Getting started
Verify the installation
After installing Grafana in the Websoft9 console, view the application details through My Applications and get the login information in the Access tab.
-
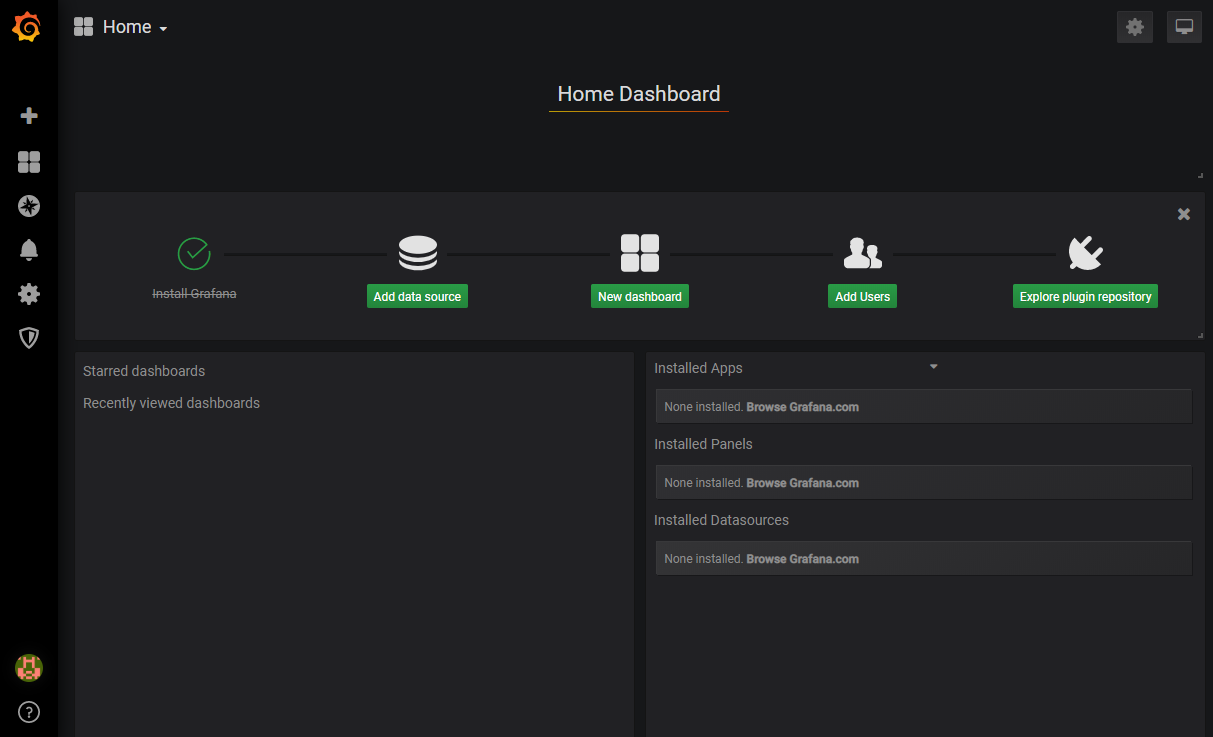
Grafana console page

-
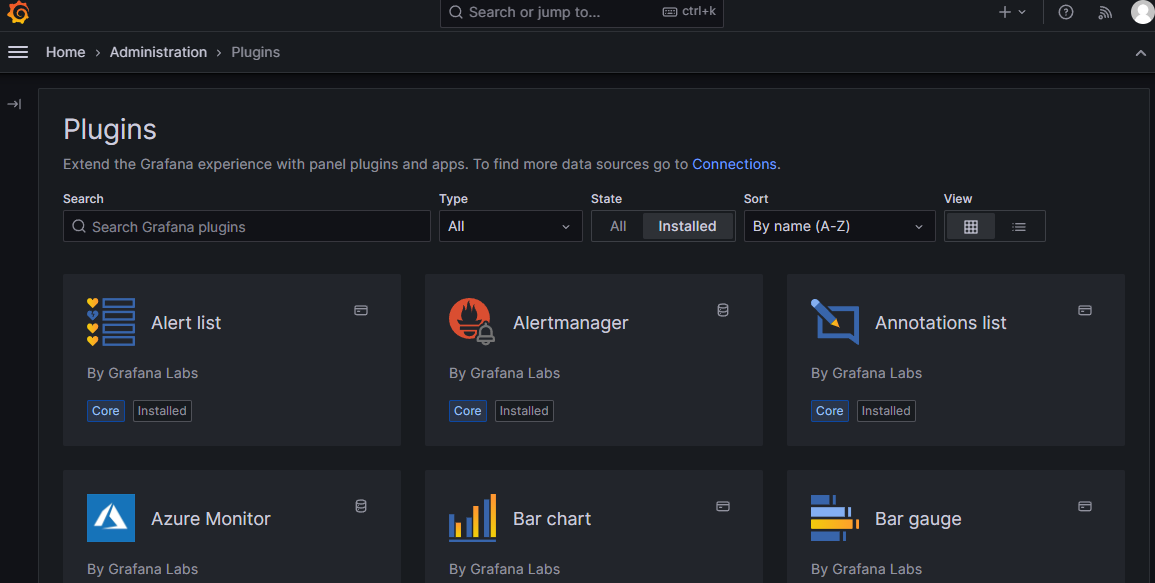
Select Administration > Plugins, and add a plugin
-
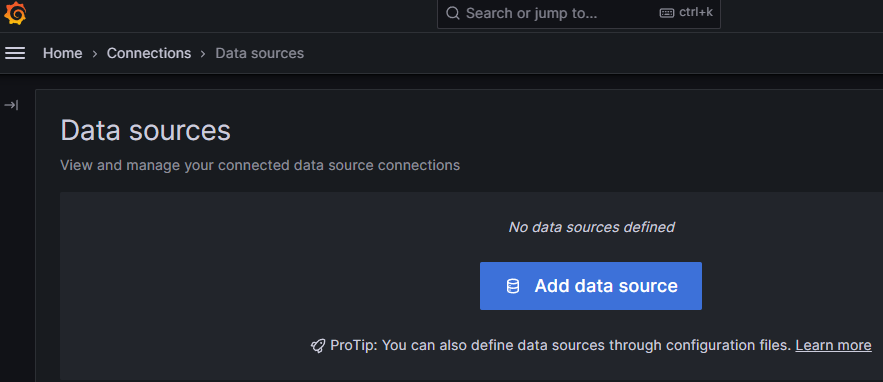
Select connections > Data Sources, and add a data source (analysis object)
Configuration options
- Configuration file (path within container): /etc/grafana/grafana.ini
- Grafana API
- Command line:
grafana-cli - Default database: Built-in SQLite
Administer
-
smtp configuration: add the smtp configuration segment to the configuration file
#################################### SMTP / Send e-mail #####################[smtp]enabled = falsehost = localhost:25user =# If the password contains # or ;, it must be enclosed in triple quotes. ex """#password;"""password =cert_file =key_file =skip_verify = falsefrom_address = [email protected]from_name = Grafanaehlo_identity =[email]welcome_email_on_sign_up = falsetemplates_pattern = emails/*.html -
Reset admin password: run the command
grafana-cli admin reset-admin-password admin123in the container -
Upgrade: Follow the instruction to Upgrade Grafana
Troubleshooting
How do I change the database?
Prepare the database, then select My Apps > compose > Go to Edit Repository > .env. Add the GF_DATABASE_URL environment variable to the .env file, and rebuild the application to apply the changes.
# mysql example
GF_DATABASE_URL=mysql://grafana:[email protected]:3306/grafana